1. The Adjustment Everyone Assumes Is Necessary
A recruitment analyst evaluates two centre-backs. One plays for a team controlling 70% of expected goals. The other plays for a team controlling 30%. The second centre-back records more tackles, more interceptions, more clearances per 90 minutes. The analyst, trained in possession-adjusted metrics, applies a correction: the second defender's numbers are inflated by opportunity, not quality. The first defender's numbers are deflated by his team's dominance. The analyst adjusts both toward a common baseline. This is standard practice.
The adjustment rests on a premise that is intuitively compelling and empirically untested at the individual level: that centre-backs on dominant teams face fewer defensive actions and therefore produce fewer defensive statistics, all else being equal. If this premise is wrong, the adjustment introduces distortion rather than correcting for it.
2. Where the Convention Comes From
The possession-adjusted defensive statistic, as a formalised metric, originates with Ted Knutson's work at StatsBomb in June 2014 [1]. Knutson proposed a sigmoid function that scaled raw defensive counts by the opponent's share of possession: the more the opponent had the ball, the more opportunities for defensive actions, so raw counts should be normalised. He tested this at the team level — aggregated tackles plus interceptions versus team-level shots conceded and goal difference — and found an R-squared of approximately 0.39. Unadjusted defensive counts showed essentially no relationship with team-level defensive outcomes.
The finding was real and useful at the level it was tested. Teams that combined high possession with high adjusted-defensive-action rates tended to concede fewer shots. The R-squared of 0.39 represented a meaningful signal where raw counts showed none.
What happened next is what this study tests. The team-level finding was extrapolated to the player level without an equivalent empirical test. StatsBomb radars adopted possession-adjusted defensive metrics as standard display features. Wyscout implemented its own variant, normalising defensive action counts to a 30-minute opponent-possession baseline [2]. FBref had not adopted the adjustment, and has since discontinued the scouting reports that would have used it [3]. The convention became infrastructure: embedded in scouting platforms, taught in analytics courses, applied to individual player evaluation as though the team-level finding transferred.
The claim that transferred was not "team-level adjusted defensive actions correlate with team-level defensive outcomes." It was a different, untested claim: "individual centre-back tackle rates are suppressed by team dominance, and therefore individual-level comparisons require adjustment." The two claims have different mechanisms, different confounders, and — as it turns out — different empirical support. The closest prior work to an individual-level test is a two-part analysis by Get Goalside Analytics [4], which tested 45 position-action combinations against turnovers per 90 using StatsBomb open data from 2015/16 and found that only 6 exceeded r = ±0.2 — a finding consistent with ours but conducted at a smaller scale, with a different dominance measure, and in a single season.
3. The Test
Population: 431 centre-backs with at least 900 minutes in a single season, drawn from the Big 5 European leagues plus Championship, MLS, Eredivisie, Primeira Liga, and other covered leagues. Per-90 defensive statistics sourced from season-aggregated player data.
Team dominance measures: Three operationalisations tested. (1) xG share (team xG / (team xG + team xGA)) — effective dominance. (2) A PPDA-derived possession proxy (team passing freedom / total passing freedom) — ball-retention dominance. (3) Raw PPDA (opponent passes per defensive action) — pressing intensity. All computed from match-level expected goals data across 192 team-seasons (2023/24 and 2024/25). The possession proxy correlates r = 0.767 with xG share, confirming that the measures capture related but non-identical dimensions of dominance.
Matching: Centre-backs matched to their club's team dominance metrics via club-name matching. Only exact or substring matches retained.
Analysis: Nine Pearson correlations: three individual defensive metrics (tackles per 90, interceptions per 90, duel win percentage) against each of the three dominance measures. Quartile comparisons of means under both xG share and possession proxy. No multi-variate modelling — the question is whether a bivariate relationship exists at all, and correlations are the appropriate first test.
4. Results
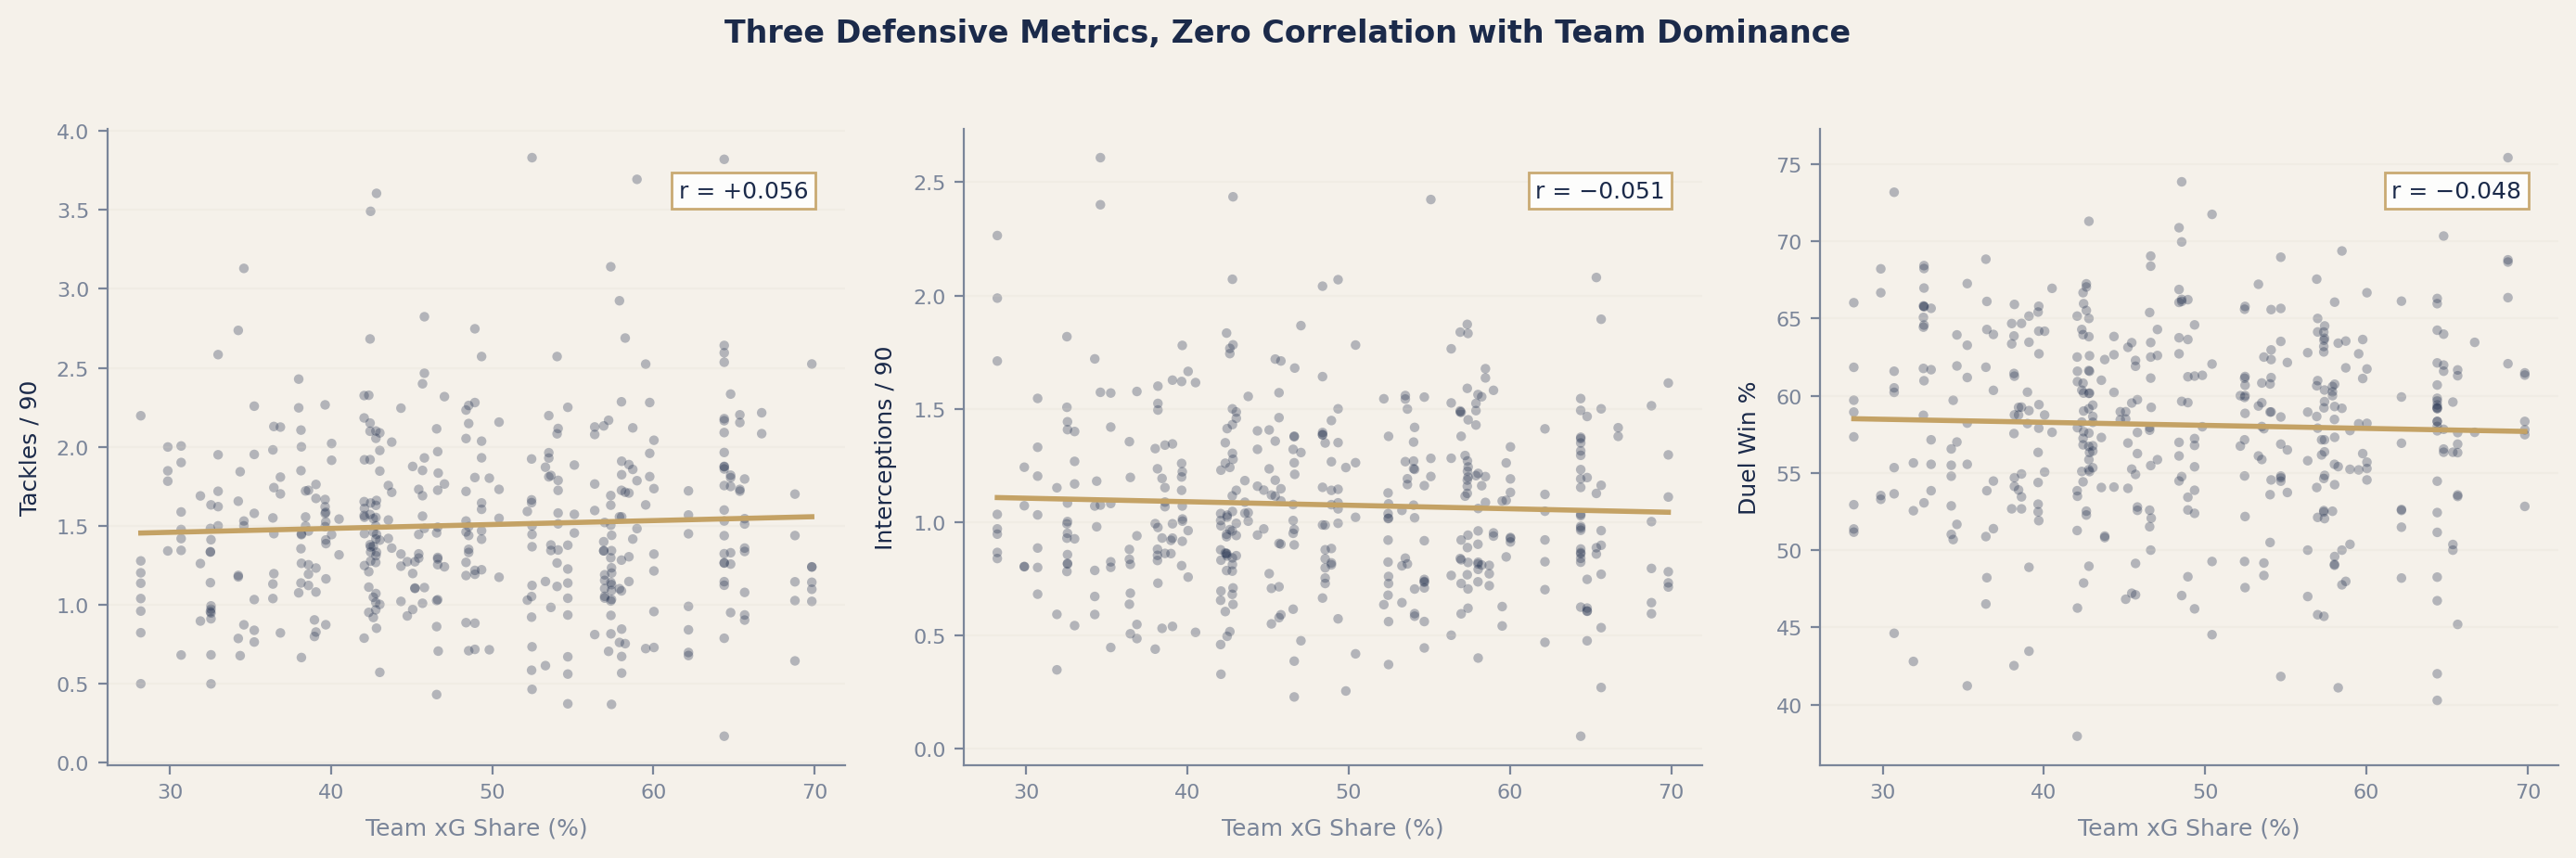
| Defensive Metric | r (vs. Team xG Share) | Direction |
|---|---|---|
| Tackles per 90 | +0.056 | Dominant teams’ CBs tackle slightly more |
| Interceptions per 90 | −0.051 | Negligible |
| Duel win % | −0.048 | Negligible |
All three correlations are effectively zero. The highest — tackles per 90 — explains 0.3% of variance. The sign of the tackle correlation is the most striking result: it is positive. Centre-backs on more dominant teams record marginally more tackles per 90, not fewer.
The quartile comparison makes the pattern concrete:
| Team xG Share Quartile | Avg xG Share | Tackles / 90 | Interceptions / 90 | Duel Win % |
|---|---|---|---|---|
| Bottom 25% (weakest) | 36.4% | 1.45 | 1.07 | 58.4% |
| 25–50% | 45.0% | 1.48 | 1.05 | 57.0% |
| 50–75% | 54.0% | 1.52 | 1.10 | 57.4% |
| Top 25% (dominant) | 65.6% | 1.57 | 1.06 | 57.7% |
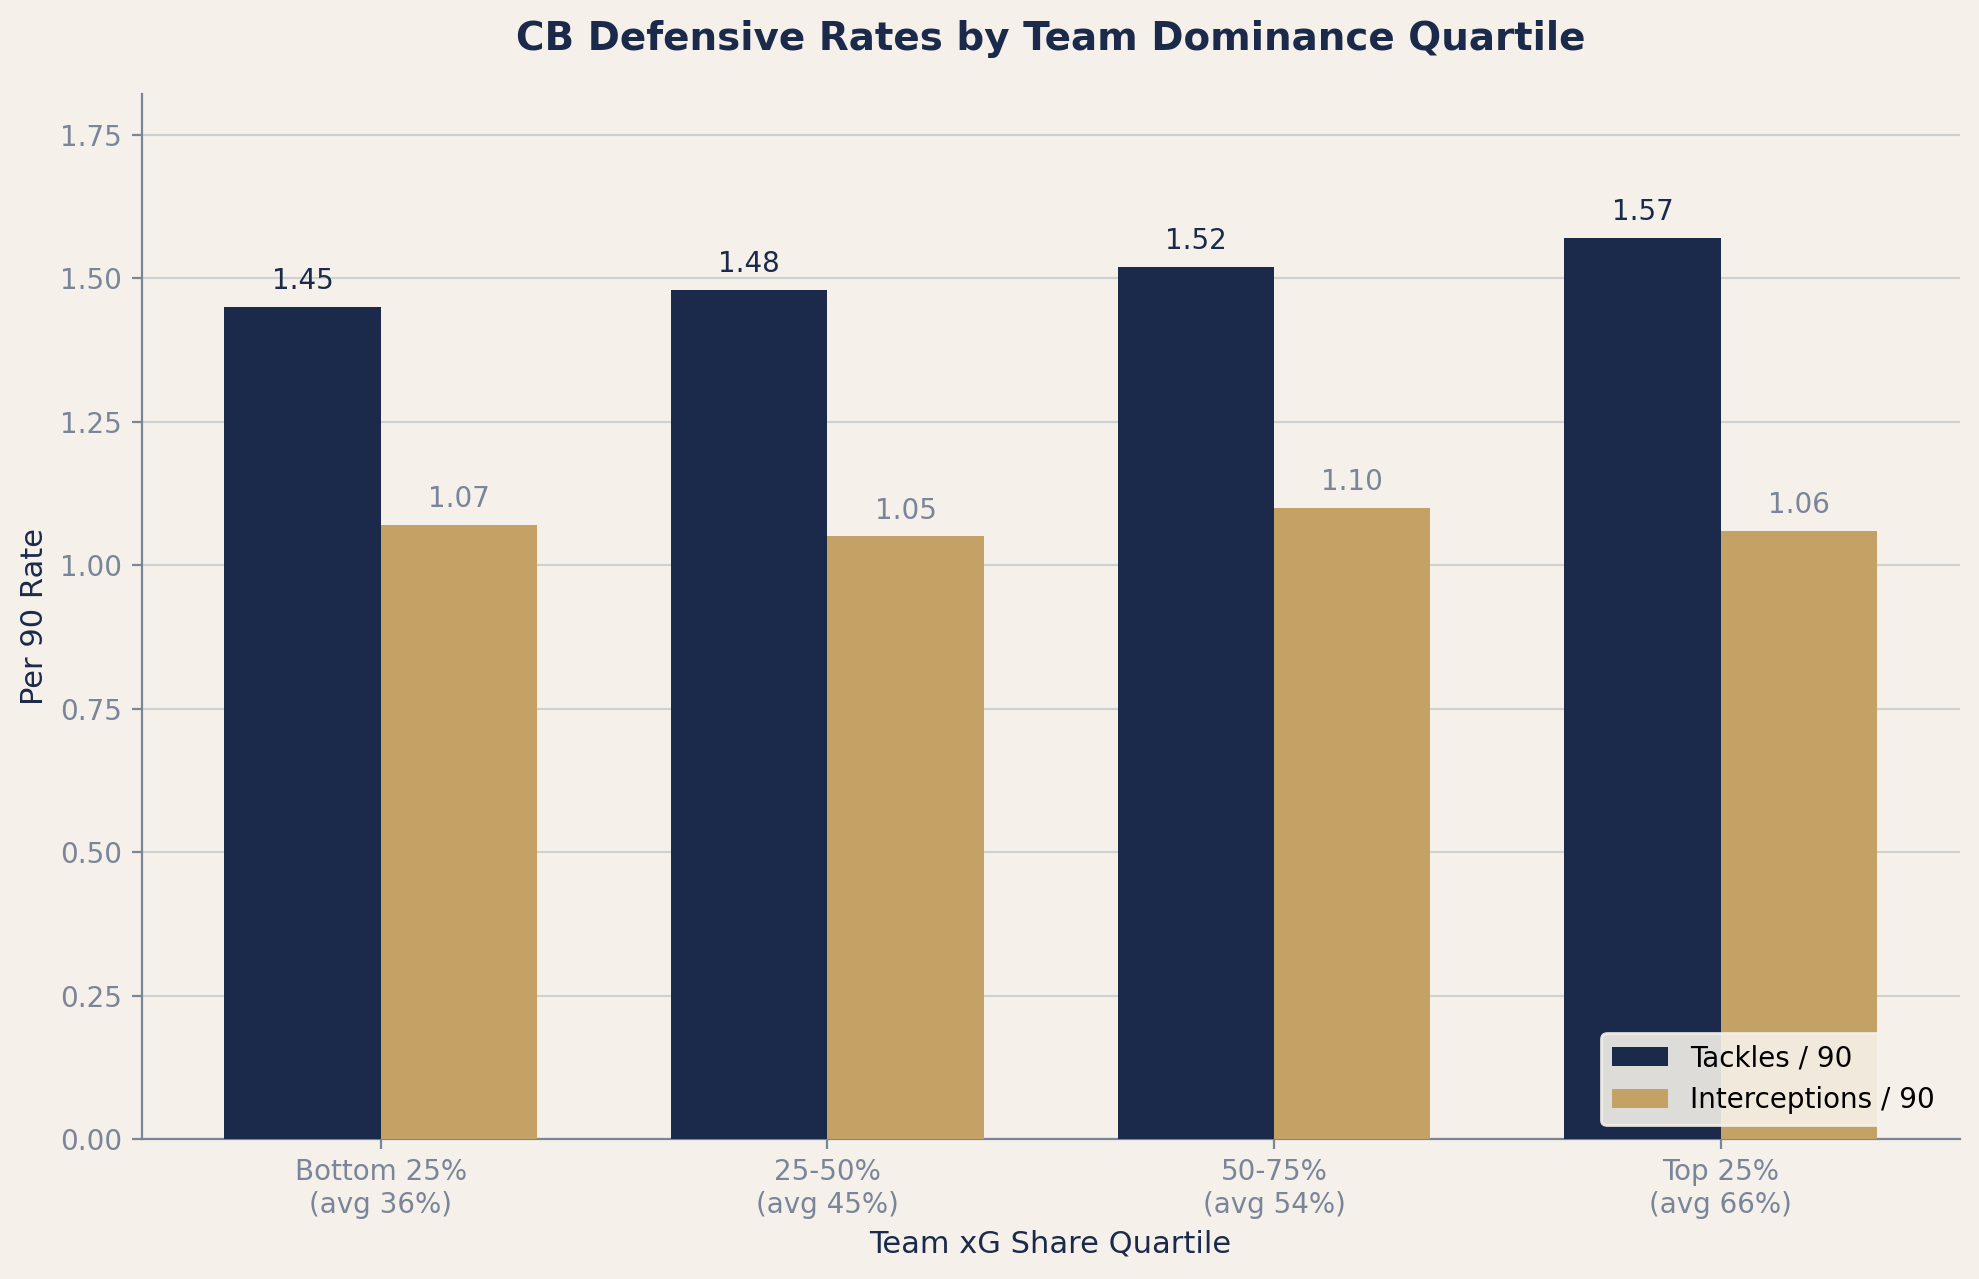
The dominant-team centre-backs tackle 8% more often per 90 than weak-team centre-backs, while their interception and duel win rates are indistinguishable across the dominance spectrum. The possession-adjustment convention assumes these dominant-team numbers are deflated by reduced opportunity — but the data shows no suppression in any of the three metrics, and in tackles, the direction is the opposite of what the convention predicts.
4.1 Robustness: Does the Operationalisation of Dominance Matter?
A reasonable objection: xG share measures effective dominance — the share of dangerous output — not ball possession. The PAdj convention adjusts by opponent possession or opponent touches, not by xG share. Perhaps the relationship holds for possession-style measures but not for quality-weighted ones.
We tested this directly. The PPDA data (Passes Per Defensive Action) in our dataset provides a match-level measure of pressing intensity and ball control that is structurally closer to raw possession than xG share is. From this we derived a possession proxy: the ratio of a team's passing freedom (passes completed per opponent defensive action) to total passing freedom for both teams. This proxy correlates r = 0.767 with xG share — strongly related but not identical, capturing the ball-retention dimension that xG share does not isolate.
We also tested raw PPDA directly. Low PPDA means the team presses aggressively — the opponent completes fewer passes before being challenged. This is the mechanism the PAdj convention is designed to capture: how much space the opponent has on the ball.
Nine correlations were tested — three defensive metrics against three dominance measures. None exceeds r = 0.07:
| Defensive Metric | vs. Possession Proxy | vs. PPDA | vs. xG Share |
|---|---|---|---|
| Tackles per 90 | +0.032 | −0.016 | +0.056 |
| Interceptions per 90 | +0.029 | −0.067 | −0.051 |
| Duel win % | −0.053 | +0.045 | −0.048 |
The finding is invariant to the measure of team dominance. Whether dominance is operationalised as xG share, PPDA-derived possession, or raw pressing intensity, the individual centre-back's defensive output is independent of it. The PPDA result adds a further wrinkle: the correlation between pressing intensity (low PPDA) and CB tackles is −0.016 — negative, meaning pressing teams' centre-backs make marginally more tackles, not fewer. The PAdj convention's own mechanism — pressing intensity — works against its prediction at the individual level.
The quartile comparison under the possession proxy replicates the pattern from the xG-share analysis. Centre-backs on dominant teams (top quartile, 61.1% possession proxy) average 1.50 tackles per 90 and 1.08 interceptions per 90. Centre-backs on weak teams (bottom quartile, 38.8%) average 1.46 and 1.02. The dominant-team defenders record more, not less, in both cases.
5. Why the Intuition Does Not Transfer
The mental model behind possession adjustment is that defending is reactive. The opponent has the ball; the defender responds. More opponent possession means more occasions to respond, which means more tackles and interceptions. Less opponent possession means fewer occasions, which means fewer defensive events. The adjustment compensates for this difference in opportunity.
This model describes a different mechanism from the one operating at the individual level. Three factors may explain why the team-level pattern does not transfer to individual centre-backs.
5.1 Pressing systems create defensive actions
Dominant teams in European football tend to press rather than sit deep. Bayern Munich's 77.2% xG share (2024/25) reflects a system where centre-backs actively initiate defensive actions: stepping into challenges in the opponent's half, cutting passing lanes, winning the ball high to restart attacks. A tackle by a pressing centre-back at the halfway line is a defensive action that follows from dominance, not one that occurs despite it.
The adjustment treats all opponent possession equally: a sustained opponent build-up against a deep block is counted the same as a momentary transition that the centre-back snuffs out at midfield. The former is the scenario the adjustment imagines; the latter is what tends to happen on dominant teams.
5.2 Selection effects
Centre-backs on dominant teams are, on average, better — which means they tend to be more assertive. They step into challenges, close passing lanes proactively, and dominate aerial contests. To the extent that per-90 rates reflect quality rather than workload, adjusting those rates downward may penalise the very quality that earned the defender a place in a dominant team.
5.3 The per-90 denominator already normalises for playing time
The adjustment addresses a confound — differential opportunity — that is partially absorbed by the per-90 rate itself. A centre-back on a dominant team may face fewer total challenges, but the per-90 rate divides by the same 90 minutes regardless. The rate is already scaled to playing time, not to defensive events faced. What the adjustment claims to correct for is a residual after this normalisation — and the data in this study suggests that residual does not exist.
6. The Cross-Domain Lesson
Every major sport has confronted the same question: how to evaluate individual defensive contributions in the presence of team-level context effects. The solutions vary, and the variation is instructive.
In basketball, the pace adjustment is universal and appropriate [5]. The NBA normalises statistics to per-100-possessions because teams play at vastly different speeds — a fast-paced team generates more total possessions per game, inflating every raw count. The adjustment works because basketball possessions are discrete, countable events with clear boundaries. Football possession is a continuous, ambiguous concept: percentage of time with the ball, number of sequences, opponent touches. The analogy between basketball's pace adjustment and football's possession adjustment is superficially appealing and structurally flawed.
In baseball, the approach that actually worked was not rate normalisation but per-event difficulty evaluation. Ultimate Zone Rating (UZR) evaluates each fielding play against the expected conversion rate for that specific batted-ball type, speed, and location [6]. A difficult diving catch contributes more to the metric than a routine fly ball. The fielder is not adjusted for the pitching staff's ground-ball rate — the metric instead evaluates what the fielder actually did, relative to what was expected of any fielder in the same situation. Baseball solved the "opportunity" problem not by normalising for context but by modelling the difficulty of each individual action.
American football's DVOA adjusts every play for down, distance, field position, and opponent quality [7]. Like UZR, it evaluates each action against what an average unit would do in the same situation — a per-event approach rather than a blanket rate adjustment.
The pattern across sports is consistent: blanket rate normalisation is the least successful approach. The successful approaches evaluate each defensive event against its expected difficulty, rather than adjusting the total count by a team-level contextual factor. Football's possession adjustment occupies the same methodological position that other sports moved past when they adopted per-event models.
7. What This Means for Defender Evaluation
The finding that possession adjustment introduces noise rather than signal does not solve the harder problem. Centre-back evaluation from event data remains structurally limited because the most important defensive qualities — positioning, anticipation, communication, composure under pressure — produce no events. A centre-back who reads the game perfectly prevents the tackle from being necessary. The Maldini principle — that the best defending prevents the tackle from being necessary — operates at the level of what doesn't happen, and event data records only what does.
The path forward may lie not in better rate adjustments but in per-action difficulty modelling — the approach that baseball's UZR and American football's DVOA have demonstrated. For each defensive action a centre-back makes, what was the expected difficulty? A tackle against a top-quartile dribbler in the penalty area carries different information from a tackle against a retreating midfielder at the halfway line. The raw count treats them equally, and a possession adjustment does too — just with a different numerator. Neither captures the quality of the defender's decision-making. Merhej et al. [8] demonstrated a version of this approach for football, using deep learning to value defensive actions based on what they prevented — the expected threat of the attacking sequence that the defensive action interrupted. This is structurally closer to UZR than to PAdj: it evaluates the individual action in context, rather than adjusting the population rate by a team-level factor.
The broader point this study illustrates is that the conventions applied to existing data may matter more than the data itself. Possession adjustment was adopted as infrastructure across the industry without testing whether the premise held at the level where the adjustment is used. If this convention distorts rather than corrects, there may be others doing the same — assumptions embedded in scouting platforms, grading models, and composite ratings that have been inherited rather than verified. The productive question is not only what new data to collect, but whether the analytical conventions applied to the data we already have are doing what we think they are.
Cross-sectional design. This analysis matches centre-backs to team dominance at a single point in time. It does not track the same centre-back across teams with different dominance levels (e.g., a transfer from a weak team to a strong team). A within-player design — comparing the same defender's per-90 rates before and after moving between teams of different dominance levels — would provide a stronger causal test.
No raw possession percentage. The data sources used in this analysis do not include a direct ball-possession percentage at match level. The PPDA-derived possession proxy tested in §4.1 (r = 0.767 with xG share) is the closest available measure. Raw possession data would close this gap, though the consistency of the null result across all three tested operationalisations makes it unlikely that a fourth measure would diverge.
Big 5 league coverage for team-level data. The expected goals and pressing data cover the Big 5 European leagues. Centre-backs from leagues outside this coverage are included in the sample but their team-dominance assignment is less precise, introducing noise at the margins.
Position classification. Players classified as centre-backs who are sometimes deployed at full-back or defensive midfield may introduce noise. The analysis relies on each player's primary registered position, which does not capture within-match positional variation.
Defensive metric scope. This analysis tests three core defensive count statistics. It does not test clearances, blocks, or aerial duels won — metrics that some PAdj implementations also adjust. These would be a natural extension, though the consistency of the null result across the three tested metrics suggests the pattern would hold.
Data sources: Per-90 defensive statistics (tackles, interceptions, duels) from season-aggregated player data. Team xG share and PPDA data from match-level expected goals records covering the Big 5 European leagues, 2023/24 and 2024/25 seasons. Player-team matching via club name. All sources are structured data accessed through public or licensed APIs.
Method: Nine Pearson correlations — three individual defensive metrics against three team-dominance measures (xG share, PPDA-derived possession proxy, raw PPDA). Quartile comparisons of means under both xG share and the possession proxy. No multi-variate adjustment. The analysis tests the bivariate premise that the PAdj convention assumes: that a relationship exists between team dominance and individual defensive output.
Reproduction: Any dataset that contains (a) individual defensive per-90 rates by position with a minimum-minutes filter, (b) team-level possession, xG share, or PPDA data for the same competitions and seasons, and (c) a player-to-team mapping can reproduce this test. Raw possession percentage data (which we lack) would complete the operationalisation set. Contact: research@statswing.com