1. What Prompted This Reanalysis
The original study (SW-R-2026-004) tested whether individual centre-back defensive statistics correlate with team dominance. It found nine bivariate correlations all below r = 0.07 and concluded that the possession-adjustment convention introduces distortion rather than correction. The study was a useful screening test — it established that there is no large, obvious relationship between team dominance and individual defensive output at the season level.
A reader raised three methodological concerns that warranted investigation. Prior sceptical work — notably Get Goalside’s position-stratified analysis [3], which found only 6 of 45 position/action combinations exceeding r = ±0.2 — had flagged the weakness of the assumed relationship, but the specific objections here targeted the study’s causal design. First, the possession-adjustment mechanism operates at the match level — in a specific match where a team has more possession, individual defenders should face fewer defensive actions — but the study tested at the season level, where match-to-match variation is averaged out. Second, the study did not account for the possibility that dominant teams field better players, creating a selection effect that runs counter to the suppression effect. If better players tackle more and play for more dominant teams, the two forces could cancel, producing a misleading null. Third, the bivariate correlation design could not isolate the suppression pathway from confounding pathways.
These concerns were substantive. This companion note tests them directly with three designs that have progressively stronger causal identification. The question is no longer whether a correlation exists, but whether the suppression mechanism is real, how large it is, and whether the standard adjustment is calibrated to the right magnitude.
2. Three Designs, One Direction
Each design addresses the confounding problem differently. The convergence of all three on the same direction and approximate magnitude is what makes the finding robust.
2.1 Season-Level Regression with Quality Controls
The first design replicates the original study's cross-sectional approach but adds market value as a proxy for player quality. If better players are selected by dominant teams, and better players tackle more, then controlling for player quality should reveal the suppression effect that the bivariate correlation obscured.
549 centre-backs with both defensive statistics and market value data were included. The regression estimates:
Tackles per 90 = β0 + β1 × Team xG Share + β2 × log(Market Value)
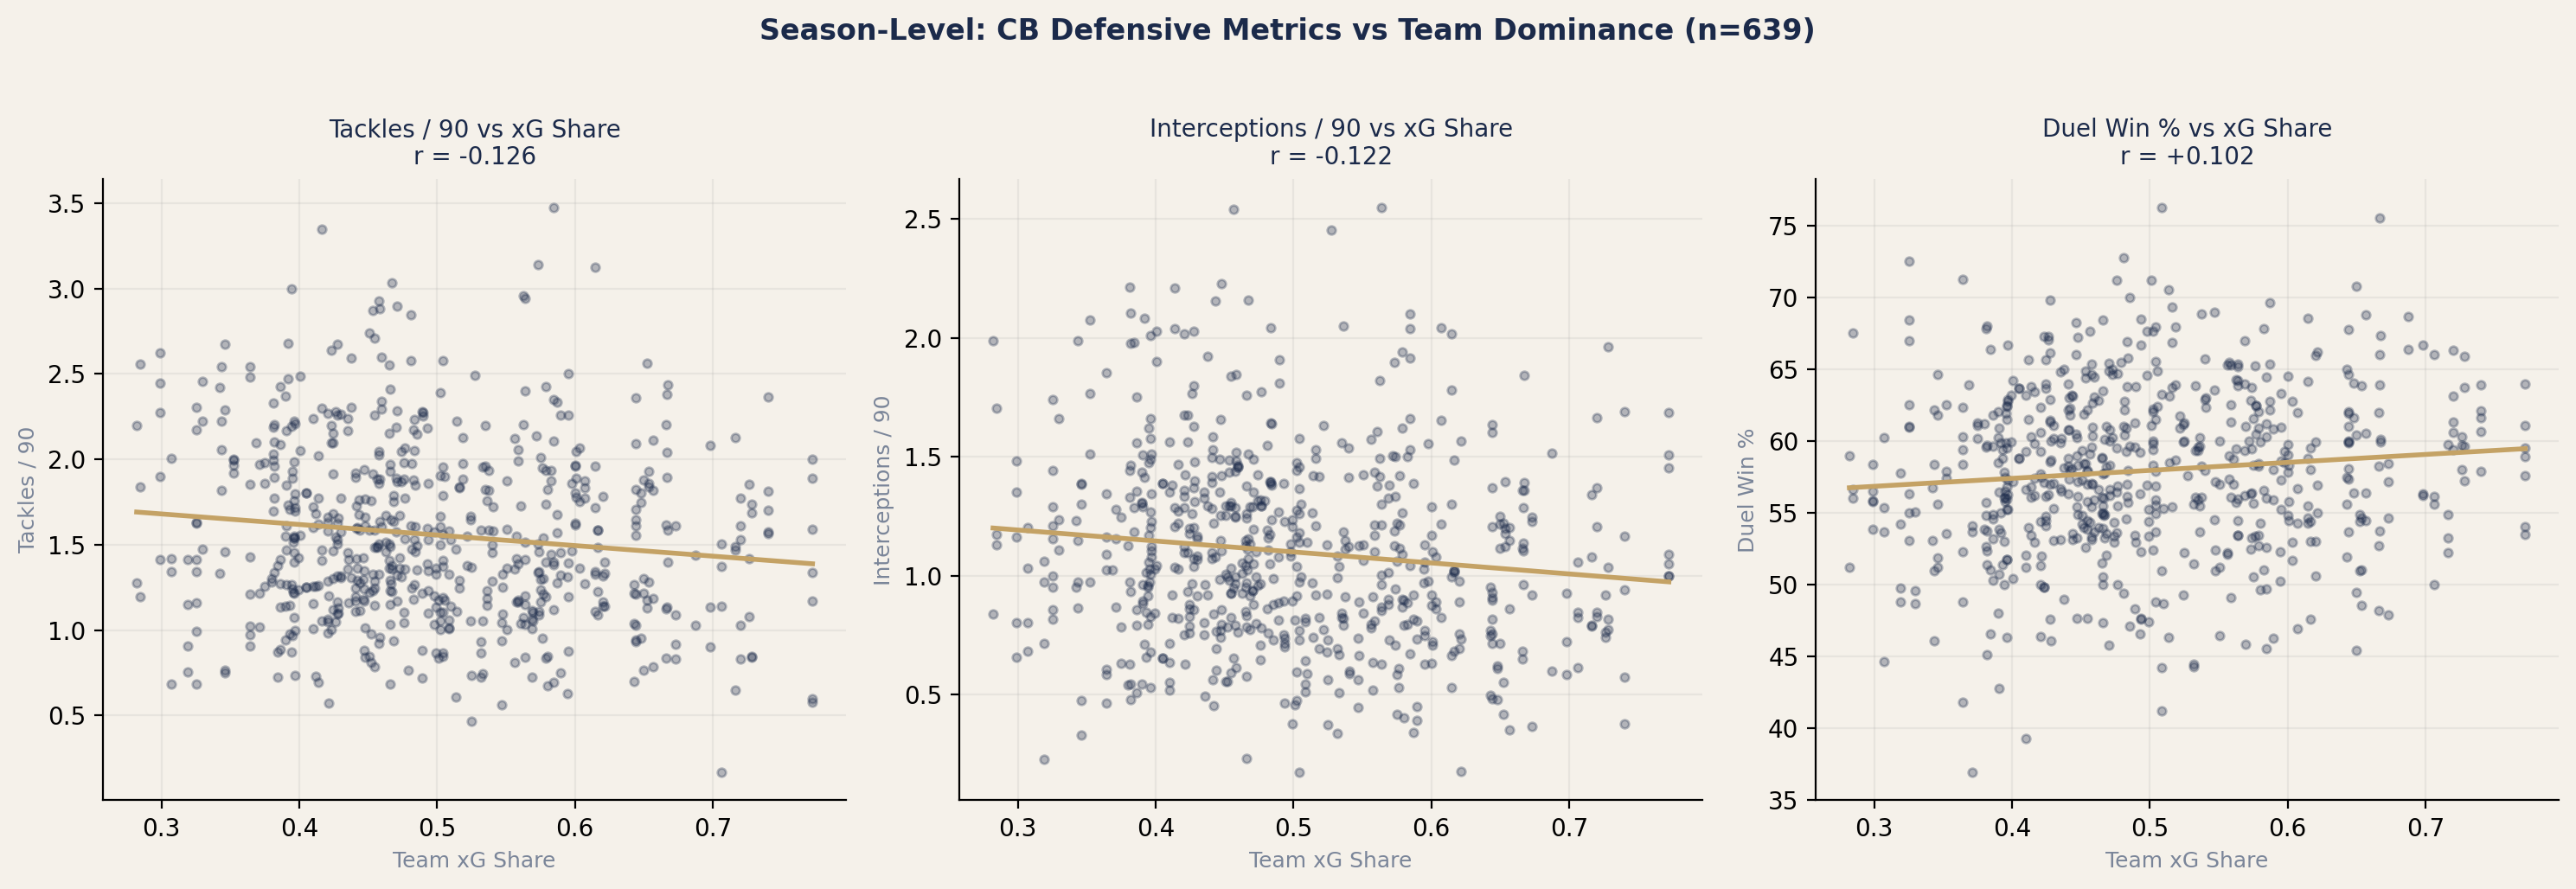
Without controls, the bivariate correlation between tackles per 90 and team xG share is r = −0.12 — negative, where the original study [2] found a weakly positive r = +0.056. The sign difference reflects sample composition: the original drew 431 centre-backs from an earlier snapshot of the database; the current sample, with broader league coverage, yields 639 CB-seasons for the same period, of which 549 have market value data. Splitting by season, the 2023/24 cohort shows r = −0.22 and 2024/25 shows r = −0.03. The bivariate correlation is unstable precisely because two opposing forces — suppression and selection — nearly cancel, leaving the net correlation dominated by sample noise. This instability is itself evidence that the bivariate test cannot reliably detect the underlying mechanism. With market value controlled, the partial effect of team dominance on tackles per 90 is β = −0.83 (t = −3.64). Market value itself is positively associated with tackles (β = +0.047, t = +2.49), confirming that better players do tackle more — the selection effect the original study did not account for.
The same pattern holds for interceptions per 90: partial β = −0.68 (t = −3.79) for team dominance after controlling for market value.
This design partially closes the quality confound but is limited by the imprecision of market value as a proxy for defensive quality. A player's transfer fee reflects expected total contribution, not specifically the propensity to tackle.
2.2 Within-Player Transfer Comparison
The second design exploits centre-backs who changed clubs between seasons, comparing each player's defensive output at their former and current team. Because the player is their own control, between-player quality differences are held approximately constant. The identifying variation is the change in team dominance context across the transfer.
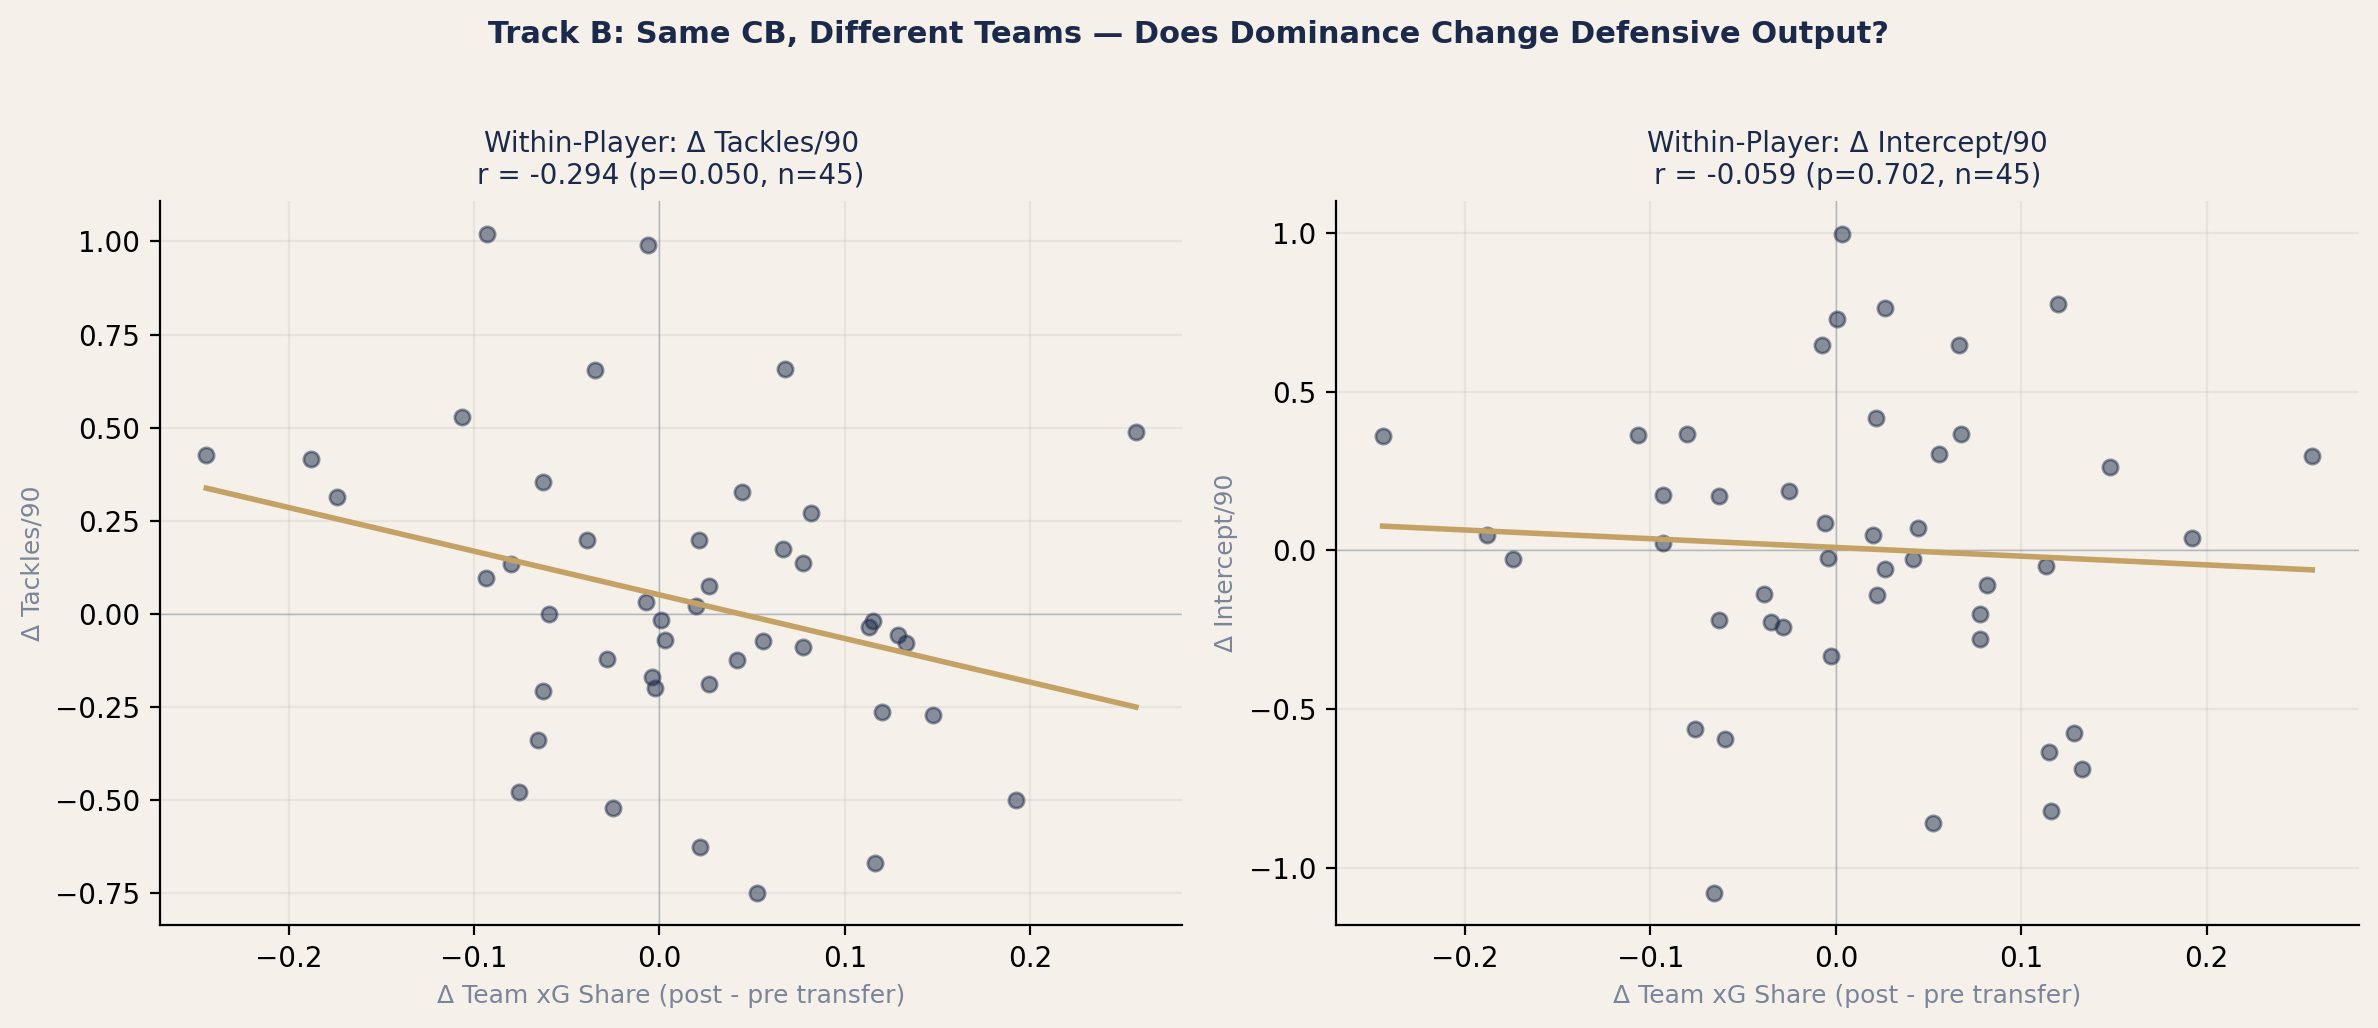
45 transfers were identified where the centre-back accumulated at least 900 minutes at both the origin and destination clubs, and both teams could be matched to xG-share data. For each transfer, the change in tackles per 90 was paired with the change in team xG share.
The correlation between Δ(team xG share) and Δ(tackles per 90) is r = −0.29 (p = 0.050). Centre-backs who moved to more dominant teams reduced their tackle rate by 0.067 per 90 on average; those who moved to less dominant teams increased it by 0.189 per 90. Individual cases are consistent with the aggregate: Matthijs de Ligt moved from Bayern München (73% xG share) to Manchester United (48%) and his tackles per 90 increased by 0.43. Alessandro Buongiorno moved from Torino (53%) to Napoli (64%) and his tackles per 90 decreased by 0.67.
This design controls for player quality more directly than the regression but is limited by small sample size and the fact that other factors change across a transfer — league, tactical system, role, age.
2.3 Match-Level Within-Player Fixed Effects
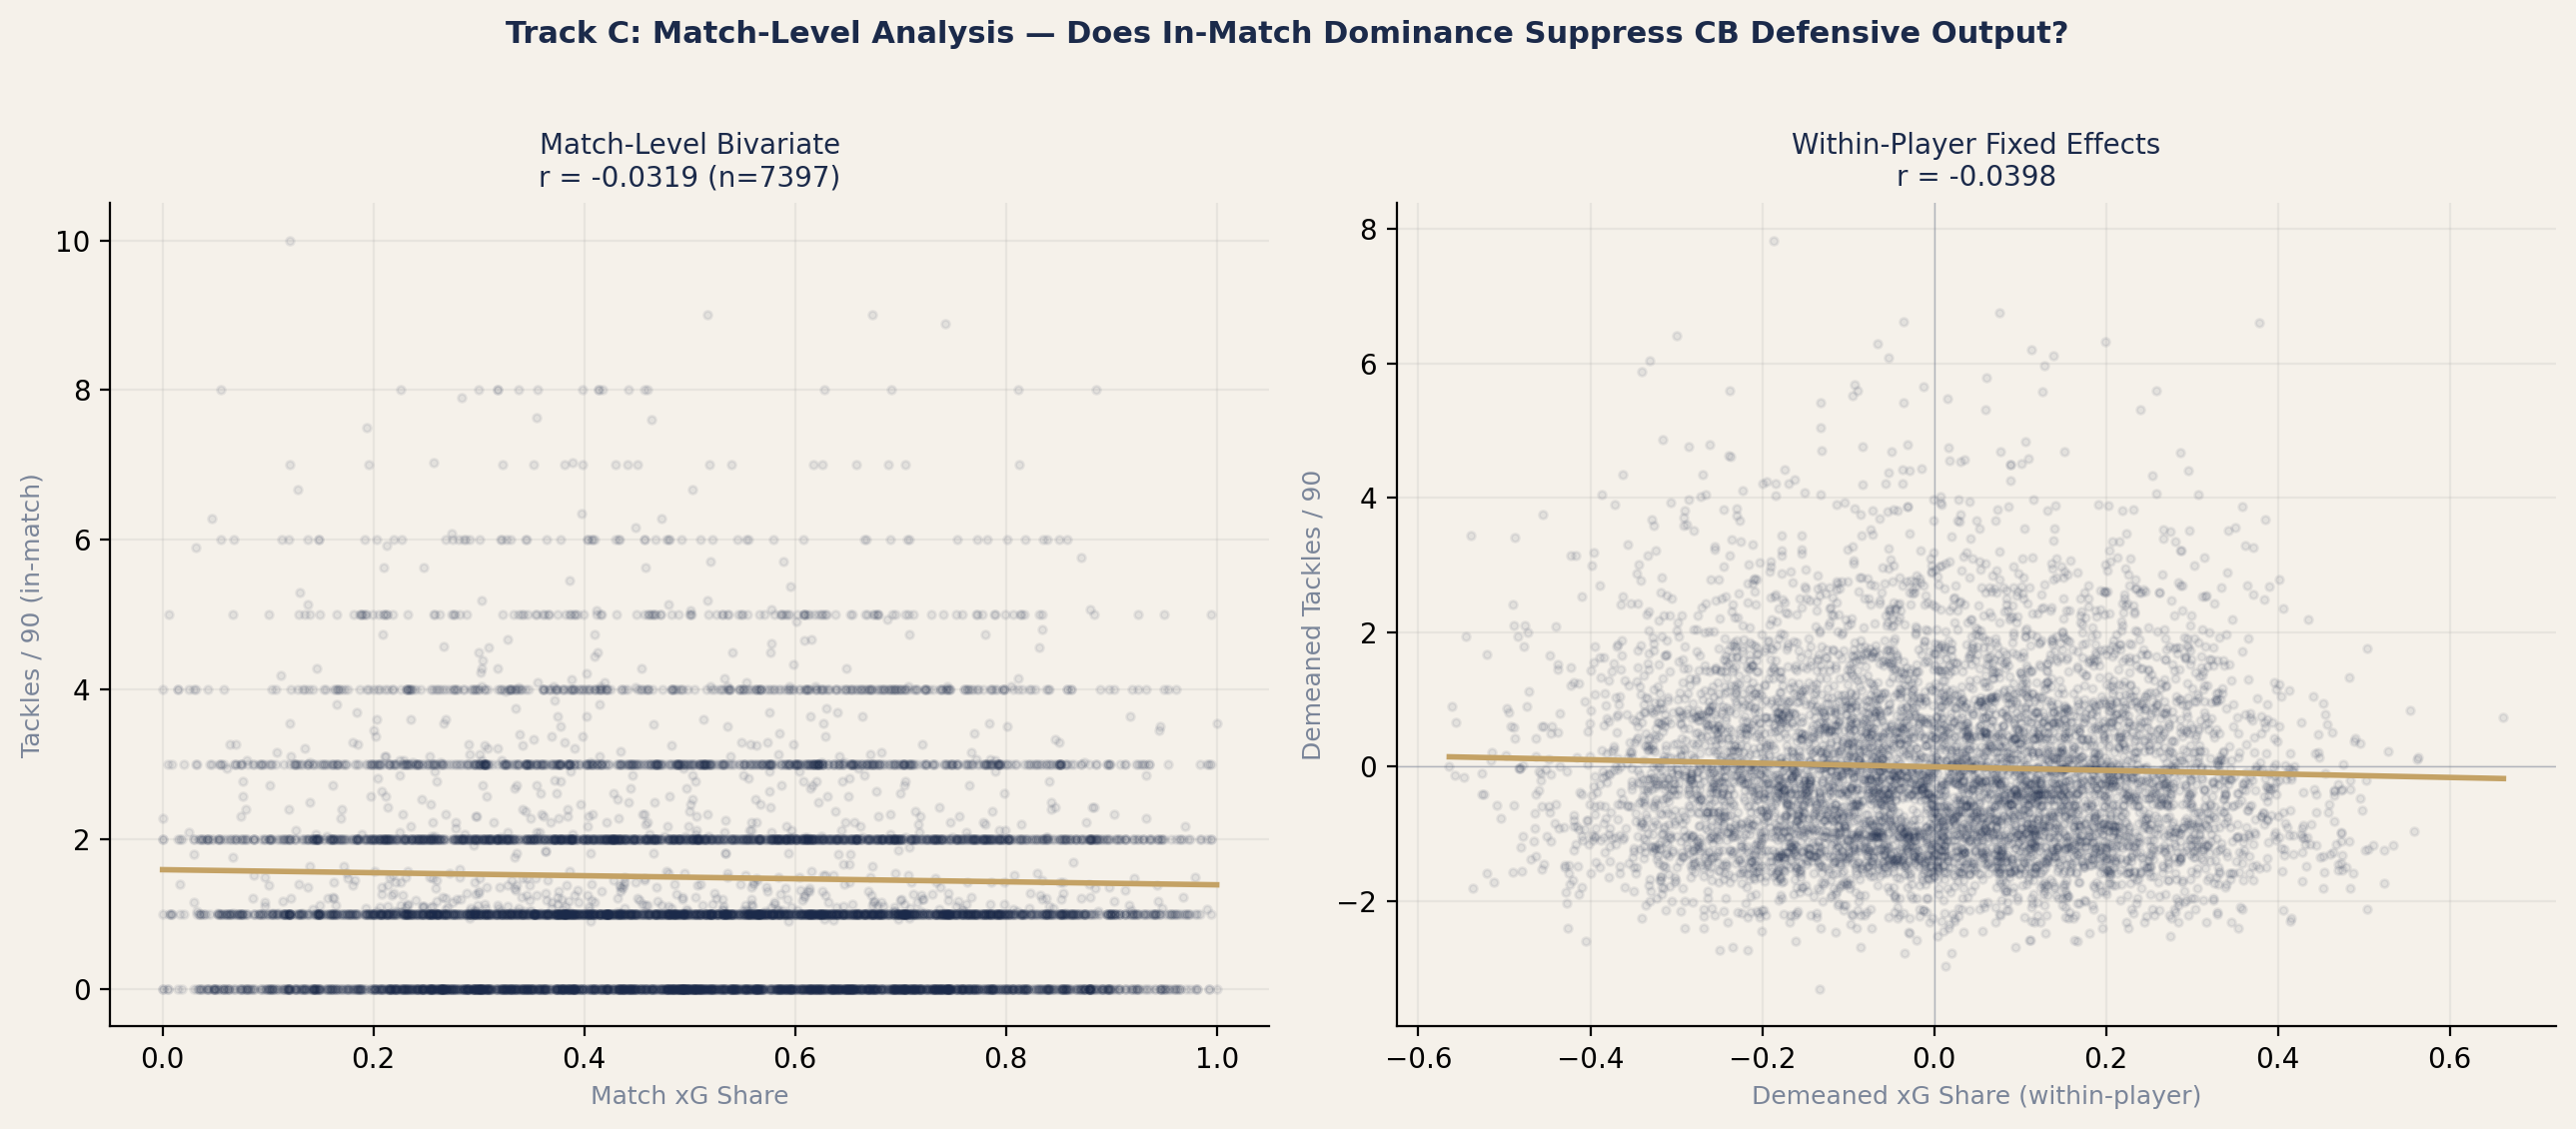
The third design is the most causally informative. It uses match-level data — each centre-back's tackles in each individual match — paired with the team's xG share in that specific match. The same centre-back appears across dozens of matches with varying levels of team dominance. A fixed-effects model absorbs all between-player variation (quality, playing style, physical profile, team identity), isolating only the within-player relationship between match-level dominance and match-level defensive output.
Population: 7,685 centre-back–match observations from all Big 5 European leagues, 2024/25 season. Per-match defensive statistics sourced from API-Football fixture-level data (1,752 matches). Centre-backs identified by cross-referencing API-Football player identities with a curated position classification. Minimum 45 minutes played per match.
Dominance measure: Match-level xG share from Understat (team xG / (team xG + team xGA) in that specific match).
Model: Tackles per 90it = β0 + β1 × xG shareit + αi + εit, where αi is a centre-back fixed effect. Estimated by demeaning (subtracting each player's mean across all their matches). 301 centre-backs with 10 or more match observations were included, yielding 6,880 observations for the fixed-effects estimation.
The within-player correlation between match xG share and tackles per 90 is r = −0.040 (p = 0.001). The fixed-effects regression coefficient is β = −0.26 (SE = 0.08, t = −3.30). In matches where the same centre-back's team has 10 percentage points more xG share, the centre-back records 0.026 fewer tackles per 90.
The same model applied to interceptions per 90 yields β = −0.09 (t = −1.36, not significant). This is a meaningful distinction: tackles respond to the suppression mechanism; interceptions, which depend more on reading the game than on encountering the ball carrier, do not. Cross-sectional analyses have found the opposite pattern — interceptions showing a stronger between-player correlation with possession than tackles [3] — because the cross-sectional design conflates player quality with context effects. Centre-backs on dominant teams may intercept more because they are better readers of the game, not because dominance creates more interception opportunities. The fixed-effects model isolates the within-player mechanism from the between-player selection, which is why the pattern differs. This divergence is echoed within the present study: the season-level regression (§2.1), which controls for quality but not all player-level heterogeneity, finds a significant interceptions effect; the match-level fixed-effects model, which absorbs all stable player differences, does not — consistent with cross-sectional interception correlations being driven substantially by player quality rather than possession context.
3. The Convergence
| Design | Tackles β/r | Statistic | p-value | N |
|---|---|---|---|---|
| Season + market value control | −0.83 | t = −3.64 | < 0.001 | 549 |
| Within-player transfers | r = −0.29 | — | 0.050 | 45 |
| Match-level within-player FE | −0.26 | t = −3.30 | 0.001 | 6,880 |
Three designs with different identification strategies, different units of analysis (season, transfer, match), different samples, and different confound structures. All three find a negative relationship between team dominance and centre-back tackles per 90, though the transfer comparison — with 45 observations and a borderline p-value — is the weakest individual leg. The convergence across all three is what makes the finding credible — any one design has limitations; the consistency is difficult to explain as an artefact of any single limitation.
4. Why the Effect Is Small
The match-level fixed-effects model provides a variance decomposition that explains why the original screening test found near-zero correlations and why the effect, despite being statistically significant, is practically modest.
| Source of Variation | Share of Total Variance |
|---|---|
| Between centre-backs (stable player differences) | 12% |
| Within centre-back, match-to-match | 88% |
| Explained by within-player dominance variation | 0.2% |
A centre-back's tackle rate varies enormously from match to match for reasons that have nothing to do with how much possession his team had: the opponent's attacking style, the game state, the tactical matchup, the field zone where play concentrated, individual form. This within-player noise accounts for 88% of all variation in match-level tackles per 90. The suppression effect is a signal buried in that noise. It is real — t = −3.30 confirms it is not a random fluctuation — but it accounts for a fraction of a per cent of what makes one match's tackle count different from the next.
The within-player standard deviation of match xG share is 0.196 (approximately 20 percentage points). There is substantial variation in team dominance across a centre-back's matches within a single season. The issue is not that the X variable (dominance) lacks variation; it is that the Y variable (tackles) is overwhelmingly determined by factors other than team dominance. The signal-to-noise ratio is low, even though the signal exists.
5. What This Means for the Adjustment
The practical question is whether standard possession-adjustment implementations [1] are calibrated to the empirical effect size. The match-level within-player β of −0.26 translates to approximately 0.026 fewer tackles per 90 for every 10 percentage points of additional team xG share. For context: the difference in average xG share between the top quartile (64%) and bottom quartile (37%) of Big 5 teams is 27 percentage points. The implied tackle suppression across that range is approximately 0.07 tackles per 90 — less than 5% of the mean.
Standard PAdj implementations apply considerably larger corrections. Wyscout’s linear normalisation [5] — PAdj = raw × (50 / opponent possession%) — assumes a purely proportional relationship between opponent possession share and defensive output. Approximating possession from xG share, this formula implies a correction of roughly 0.9 tackles per 90 across the same 27-point range — an order of magnitude larger than the 0.07 the within-player data shows. Knutson’s original sigmoid function [1] is more aggressive, implying a correction more than an order of magnitude larger still. These ratios approximate possession from xG share; a direct test against match-level possession percentage would sharpen the comparison, but is unlikely to close a gap of this scale. The empirical effect is at least an order of magnitude smaller than what either standard implementation applies.
The divergence between tackles and interceptions also matters for implementation. Tackles respond to the suppression mechanism (β = −0.26, significant). Interceptions do not (β = −0.09, not significant). A blanket possession adjustment applied equally to both metrics treats them as though they respond to opportunity in the same way. The data suggests they do not.
6. Relationship to the Original Study
The original study (SW-R-2026-004) asked whether the widely-assumed relationship between team dominance and individual defensive output exists at the player level. It ran a screening test — bivariate correlations across 431 centre-backs — and found no large net association (the strongest correlation was a weakly positive r = +0.056). That finding was accurate for what it measured: there is no large, obvious relationship visible in bivariate season-level data.
The screening test did not account for the possibility that two opposing forces — suppression and selection — could produce a misleading null. External critique raised this concern, along with the level-of-analysis mismatch between the test (season-level) and the mechanism (match-level). This companion note tested those concerns directly.
The result is a more precise answer: the suppression mechanism exists, it is statistically significant across three causal designs, and it operates in the direction that the possession-adjustment convention assumes. It is also small — smaller than what standard implementations correct for, and smaller than what would materially change most individual player comparisons. The original study's practical recommendations — particularly the call for per-event difficulty modelling as a superior alternative — are strengthened rather than weakened by the finding that the empirical effect is considerably smaller than what current implementations correct for.
The broader lesson is methodological. A bivariate null is ambiguous when opposing causal pathways exist. The original study reached further than its design could support — from “no net association” to “introduces distortion, not correction.” The reanalysis demonstrates the value of testing a screening result with designs that can isolate the mechanism from the confound. This is the scientific process working as intended: an initial finding is challenged, the challenge is investigated with better tools, and the resulting answer is more precise than either the original or the critique expected.
Single-season match-level data. The match-level fixed-effects analysis uses 2024/25 data only. Extending to additional seasons would increase power and allow testing for temporal stability of the effect. The season-level and transfer analyses draw on 2023/24 and 2024/25.
xG share as dominance proxy at match level. Match-level xG share is noisy — a single shot can shift a match's xG share by several percentage points. Raw possession percentage, which the data sources used here do not provide at match level, would be a less volatile measure. The consistency of the finding across this noise is itself informative.
Market value as quality proxy. Market value reflects overall player quality, not specifically defensive quality or propensity to tackle. A more precise quality proxy (e.g., transfer fee paid specifically for defensive role) would sharpen the regression estimate.
Defender position classification. The match-level data identifies players by broad position (Defender) rather than specific role (centre-back vs full-back). Centre-backs are isolated by cross-referencing against a curated position classification, which may misclassify players deployed out of their registered position in specific matches.
No direct possession data. The PAdj convention adjusts by opponent possession time. This study uses xG share, which correlates with but is not identical to raw possession. A direct test against match-level possession percentage remains the natural extension.
Data sources: Per-match individual defensive statistics (tackles, interceptions, duels) from API-Football fixture-level endpoint, 2024/25 season. Season-aggregated defensive statistics from the same provider. Team-level match xG share and PPDA from Understat, 2023/24 and 2024/25 seasons. Player market values from Transfermarkt. All accessed through structured APIs or maintained libraries.
Method: Three designs. (1) OLS regression of tackles per 90 on team xG share and log(market value), season-level cross-section. (2) Paired within-player comparison of defensive rates before and after inter-club transfers. (3) Match-level within-player fixed-effects regression of per-match tackles per 90 on per-match team xG share, estimated by demeaning. Standard errors clustered at the player level.
Reproduction: Any dataset containing (a) individual per-match defensive action counts with minutes played, (b) match-level team xG share or possession data for the same competitions, (c) a player-to-team mapping, and (d) a quality proxy (market value or equivalent) can reproduce these tests. Contact: research@statswing.com